Turn District Financial Data Into Visible and Actionable Insight
One AI-powered Finance Transparency Dashboard gives K–12 districts a real-time, interactive public dashboard of budgets and expenditures, trusted insights for every community member.
Districts manage millions in public funds each year, investments that directly influence classrooms, student outcomes, and community trust. Yet for many stakeholders, understanding how those funds are allocated and spent remains complex and difficult to access.
FinanceTransparency360™ transforms complex budget and bond data into clear, interactive visuals, making financial reporting transparent, accessible, and actionable for every stakeholder.
Superintendents
Strategic Financial Alignment
Understand how investments connect to district priorities and outcomes.
CFOs
Financial Clarity at Every Level
Bring budgets, spending, and planning into a unified view.
Board Members
Transparent Financial Conversations
Access spending information with greater clarity and context.
Community Members
Clearer Understanding of Funding
See how public investments support schools and student success.
Benefits
One Dashboard. Impact Across Your Entire Ecosystem.
Finance transparency creates stronger connections between district priorities, operational decisions, and community understanding, helping every stakeholder stay informed and engaged.
Inside the District
LEADERSHIP • FINANCE • OPERATIONS
Financial priorities viewed in broader district context
Clearer alignment between planning and spending
More connected operational conversations
Improved visibility across leadership teams
Beyond the District
Families · Press · Public
Financial reporting made easier to understan
More transparent conversations around public investment
Clearer visibility into district priorities
Stronger confidence through accessible information
One platform, shared transparency. FinanceTransparency360™ provides district leaders with operational insight while creating a clear and accessible financial experience for communities and stakeholders.
Core Capabilities
Features
Connected Financial Intelligence
01
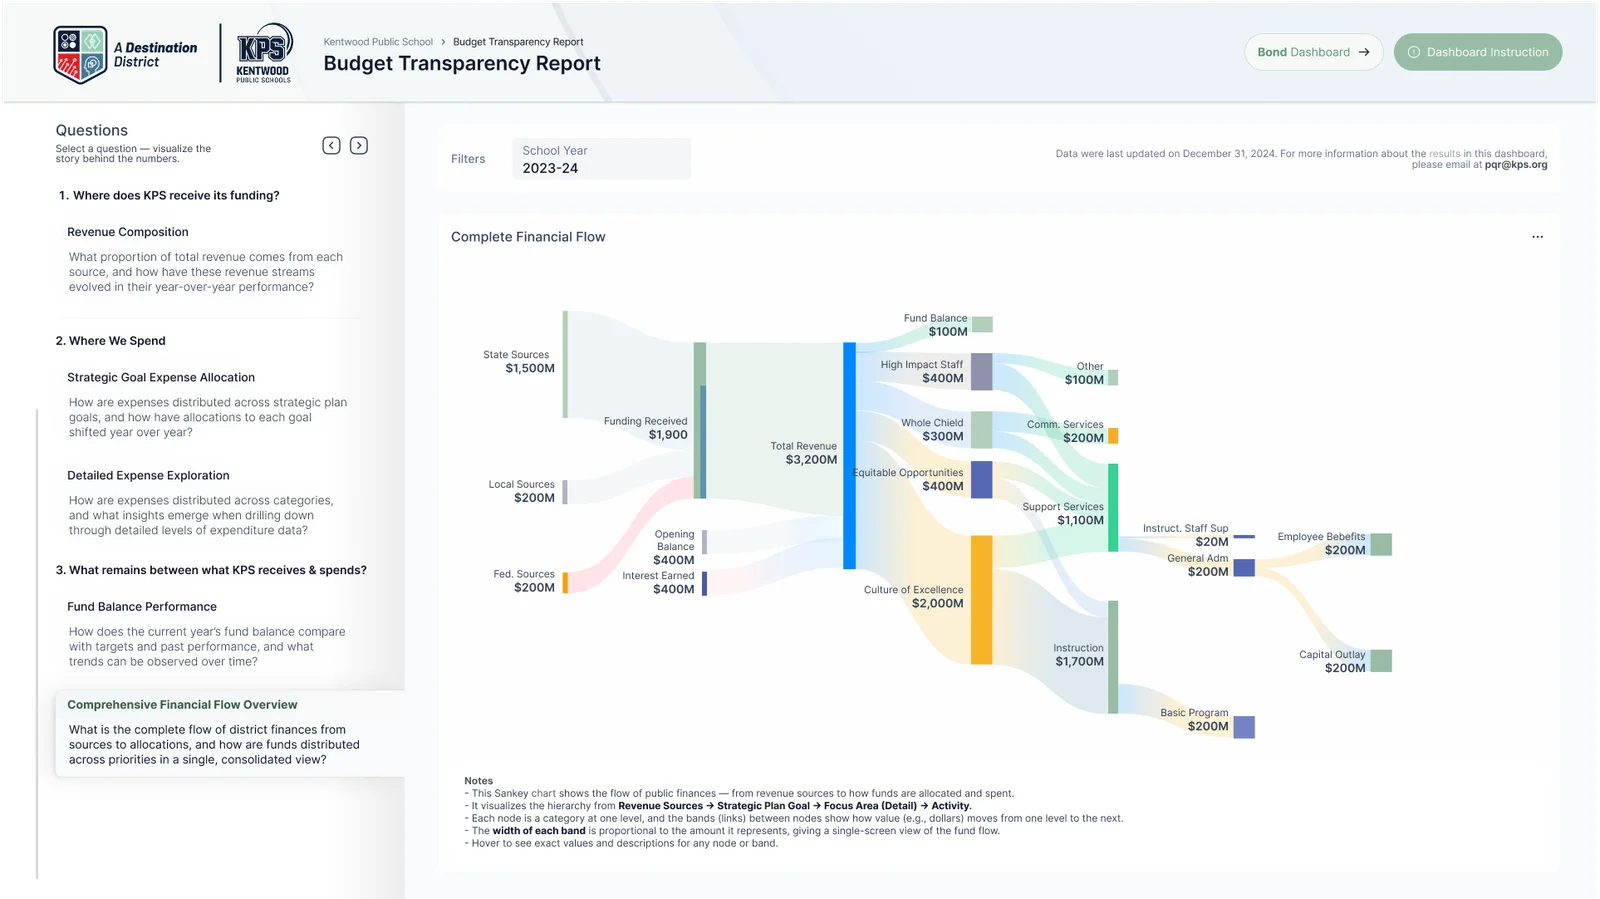
Bring financial systems, budget data, and operational information into one connected experience, helping districts move beyond disconnected reports toward more aligned planning, oversight, and decision-making.
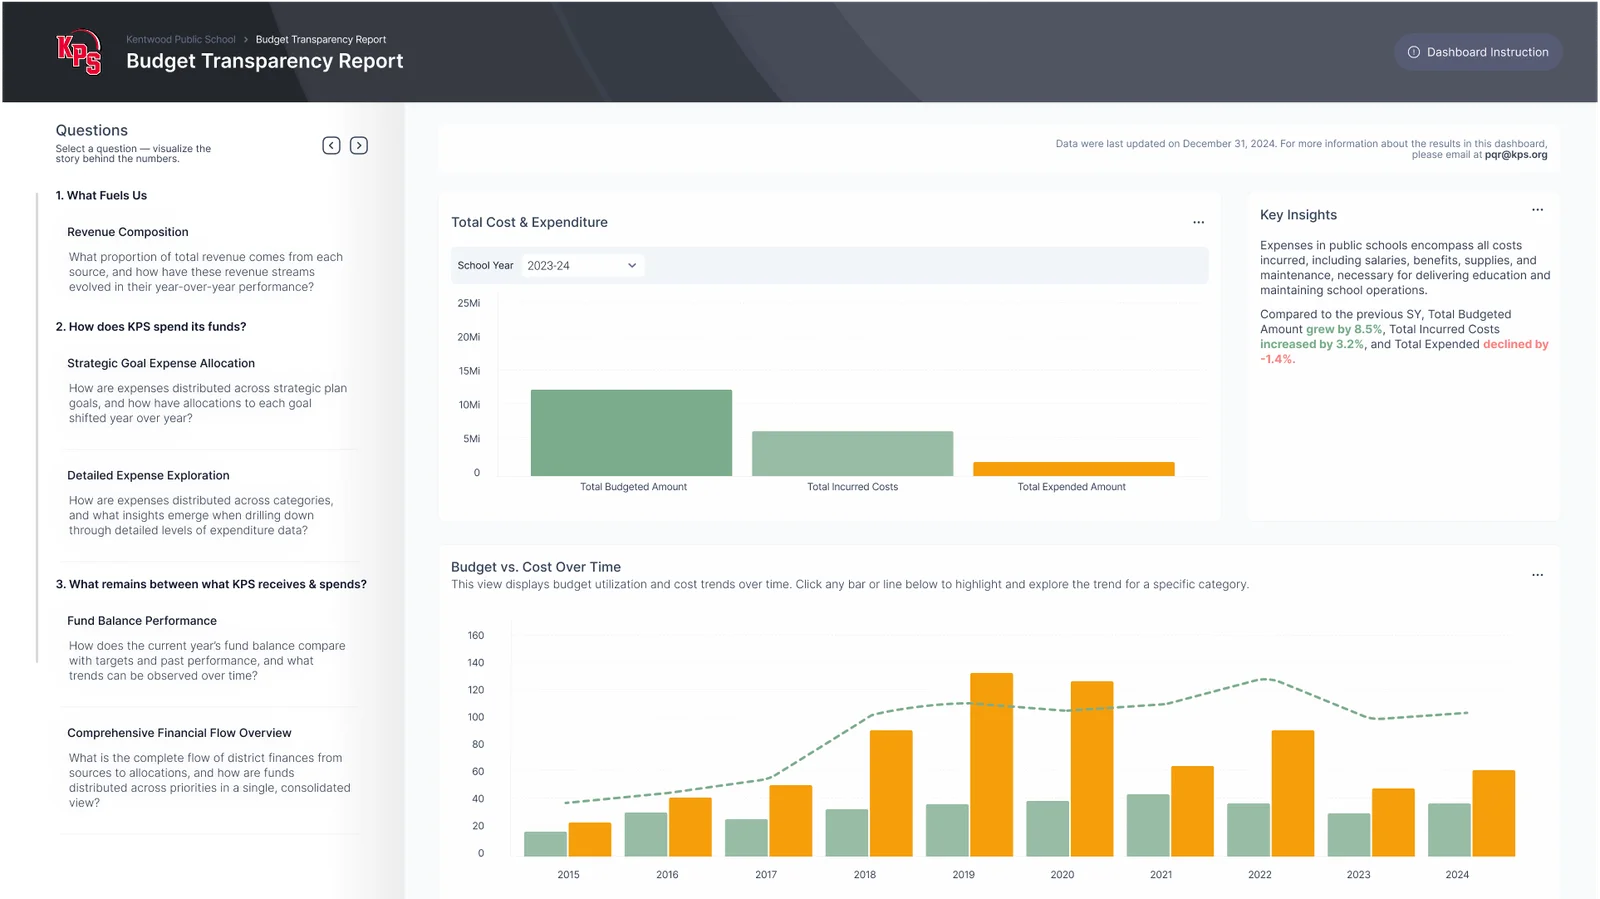
Track how planned budgets compare with actual spending across departments, schools, and funding sources, helping districts stay aligned with financial priorities through timely visibility into variances.
Navigate financial data by site, funding source, fiscal year, expenditure type, or program. Move beyond static reports and spreadsheets to explore information with greater depth and flexibility.
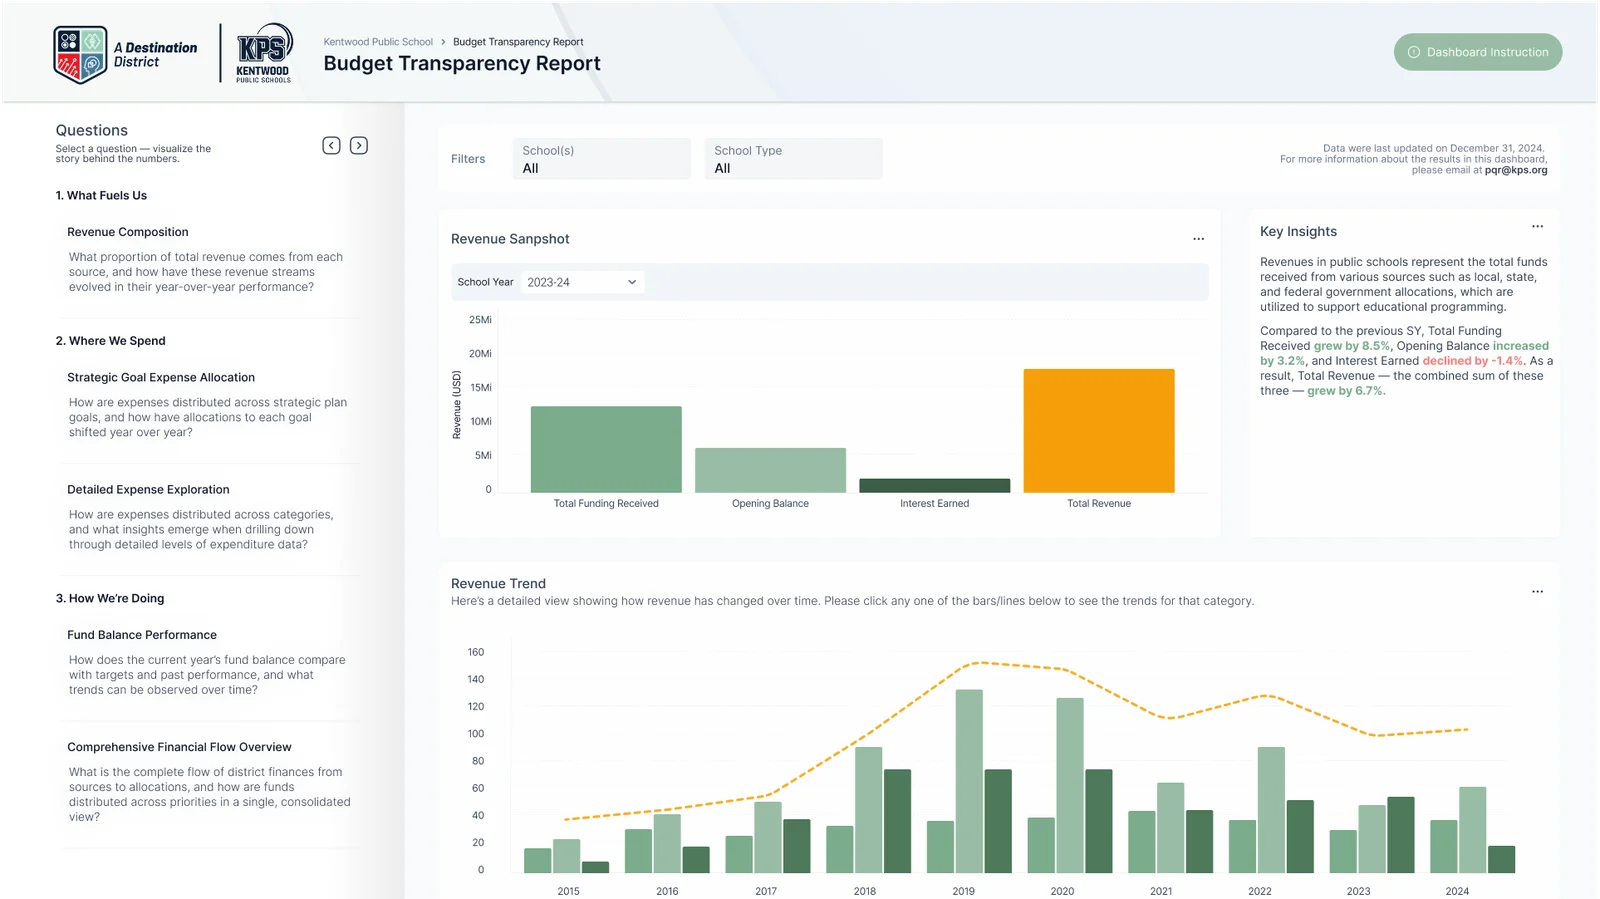
Explore spending by function, object, and program to help districts better understand resource distribution, financial priorities, and spending patterns.
Bring financial information closer to the community. Embed the dashboard on your district website to provide a clear, interactive view of funding and spending decisions.
Bring financial systems, budget data, and operational information into one connected experience, helping districts move beyond disconnected reports toward more aligned planning, oversight, and decision-making.
Budget Performance in Real Time
Track how planned budgets compare with actual spending across departments, schools, and funding sources, helping districts stay aligned with financial priorities through timely visibility into variances.
Explore Financial Data in Context
Navigate financial data by site, funding source, fiscal year, expenditure type, or program. Move beyond static reports and spreadsheets to explore information with greater depth and flexibility.
Spending by Category
Explore spending by function, object, and program to help districts better understand resource distribution, financial priorities, and spending patterns.
Public Financial Access
Bring financial information closer to the community. Embed the dashboard on your district website to provide a clear, interactive view of funding and spending decisions.
Finance transparency works best when it stays visible, accessible, and tied to action. The Finance Dashboard keeps every department, board member, and community stakeholder working from the same source of truth.
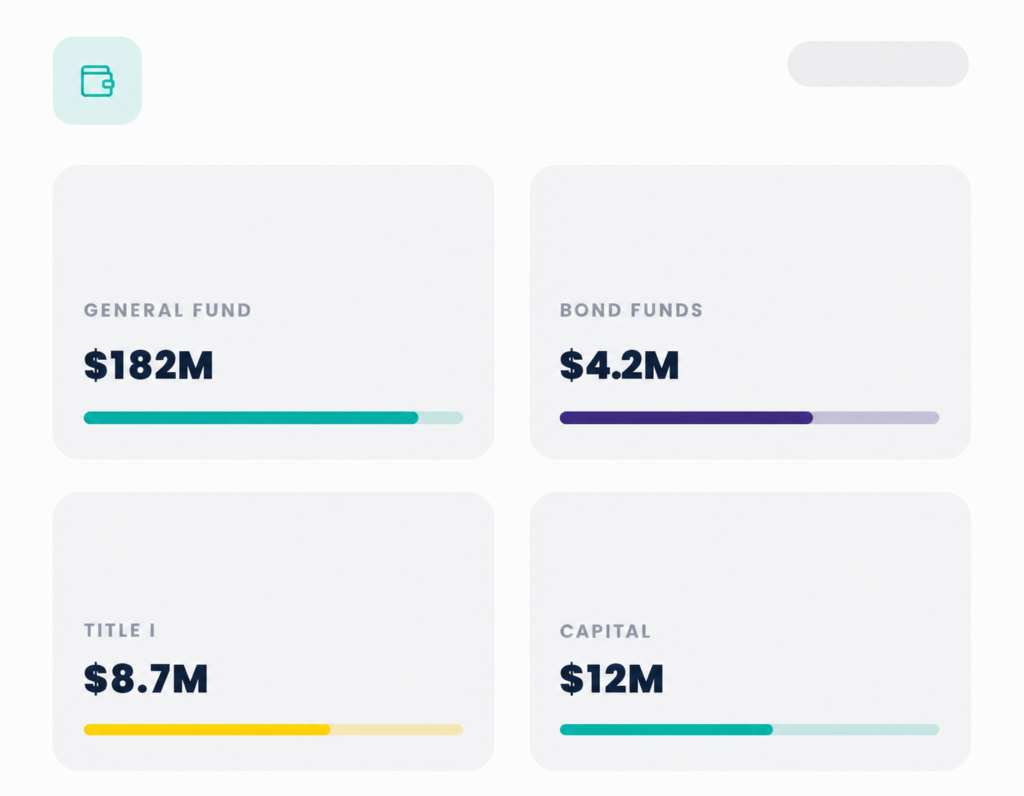
With real-time K–12 financial analytics, districts can track:
Budget Tracking
Department, school, and program-level allocations
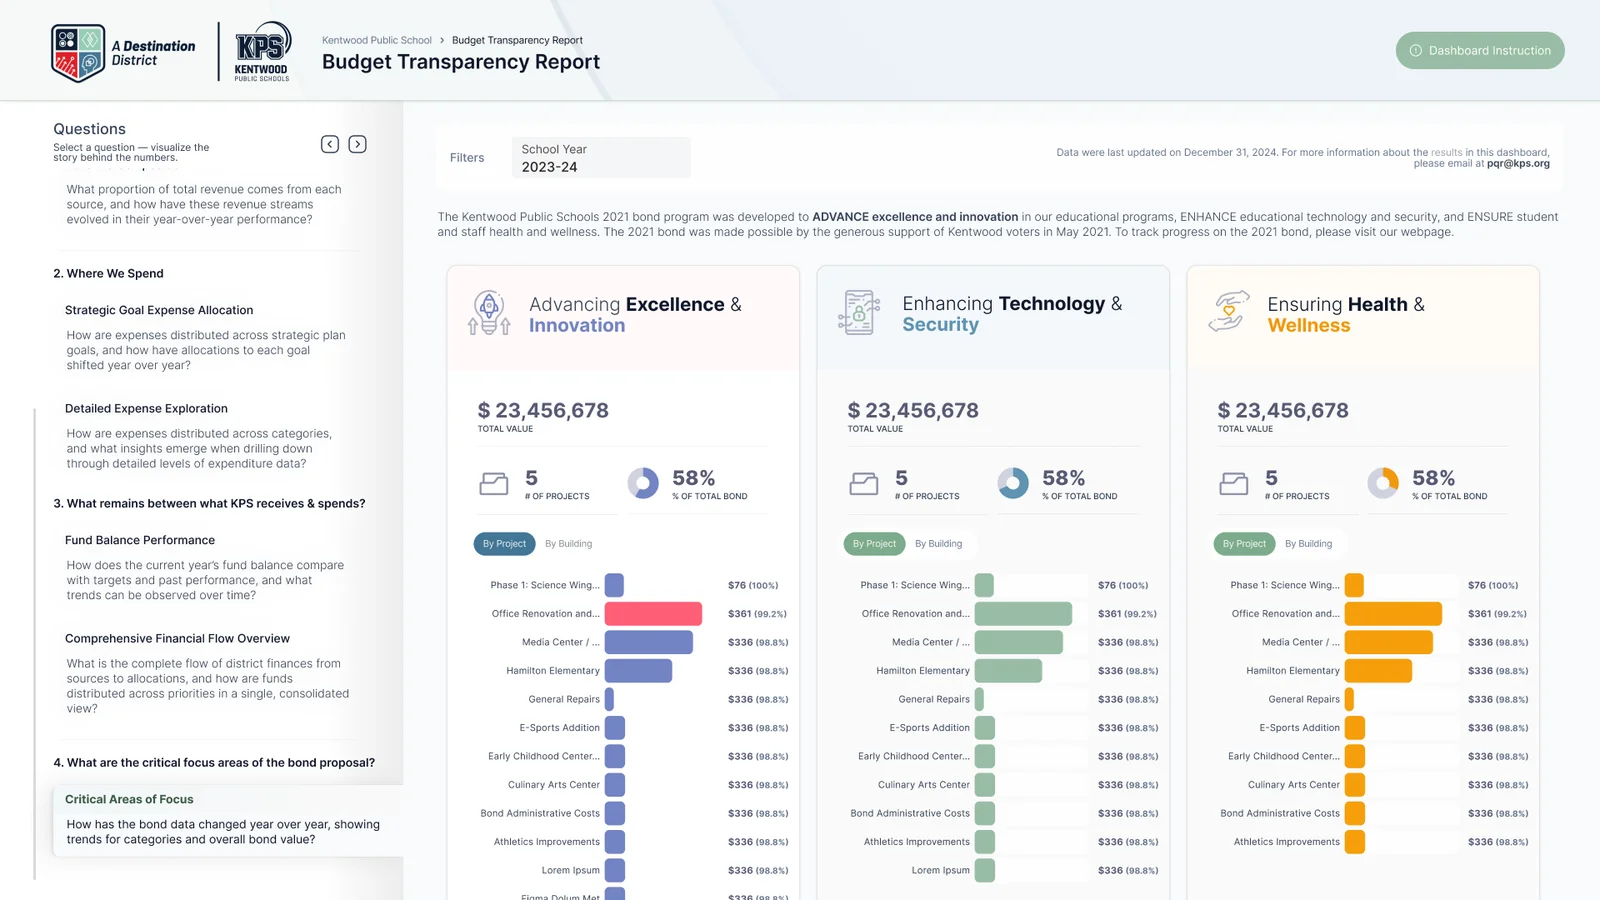
Bond Funds
Capital project spending, encumbrances, and milestones
Spending by Category
Function, object, and program breakdowns
Per-Pupil Spending
Compare across schools and demographics
Grant Management
Title I, IDEA, ESSER, and state grants in one place
Public Reports
Embed dashboards on district sites for community access
Cash Flow
Real-time visibility into reserves and obligations
Audit Readiness
GASB, GAAP, and state reporting compliance
AI-Powered
Here’s why districts trust us
Finance transparency creates value at every level — from district leadership making operational decisions to families seeing how every dollar supports their students.
Built for Education Leaders
Designed for the unique needs of district finance, strategy, and operations — whether K–12, P–20, or higher ed.
Trusted Across Districts
From large urban systems to smaller regional districts, leaders rely on our platform for transparency and accountability.
Transparency Partner
Meet state and federal reporting requirements while building public trust with easy-to-understand visuals.
Real-Time, Integrated
Sync seamlessly with your SIS, ERP, and financial systems for always-accurate reporting.
Frequently Asked Questions
How quickly can districts begin using FinanceTransparency360™?
Implementation timelines vary by district systems and reporting needs, but the platform is designed to help districts move toward faster financial visibility and public engagement.
Who typically uses the finance dashboard within a district?
FinanceTransparency360™ supports multiple audiences, including superintendents, CFOs, finance teams, board members, and community stakeholders — each accessing financial information in ways relevant to their role.
Will community members need financial expertise to understand the dashboard?
No. FinanceTransparency360™ presents financial information through clear visuals and intuitive exploration, making district finances easier to understand for broader audiences
How does financial visibility support district accountability?
When financial information is easier to access and understand, districts can strengthen communication, improve shared understanding, and build greater confidence around financial decisions.
Ready to transform financial visibility with FinanceTransparency360™?
Support stronger conversations, clearer understanding, and greater trust across your district community.